
For marketers, tracking ads is just as important as designing them. Being mindful of benchmarks not only tells us what’s working, but also teaches us how we can improve, and which direction to take in the future.
Advertisements come in many forms, and carry with them many different calls-to-action. Yet, the ultimate goal in almost all cases is to get the user to click a link. This link could be posted along with the ad, or the ad itself could have the hyperlink embedded.
Whether you want the reader to click-through to your social media profile, your landing page, or your online store, click-through rates are a critical metric to monitor.
In this post, we’ll discuss a few different benchmarks to track. Each offers a different view of your click-through rates, and allows you to see them from a unique perspective. When you learn to monitor your metrics well, there’s no limit to the amount of insight you can find.
When you learn to monitor important metrics from different perspectives, you find new ways to implement your strategies altogether.
Helpful click-through rate benchmarks to monitor
While most marketers are very familiar with the concept of click-through rate, it helps to add a little refresher before we dive into the specifics.
Click-through rate is the ratio of clicks your link receives to impressions the link makes. It could be thought of as an average, and one of the most important figures in pay-per-click advertising.
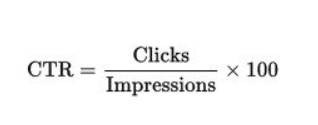
Image from Conversion XL
If this number is high, it’s a good sign—it means your ad is getting a lot of attention. Yet, it doesn’t tell the whole story. Here are five key benchmarks you can use to get the most out of this metric and learn to see the full picture of what it offers.
1. Compare click-through rates within your industry.
When you’re looking at the success of your ads, it’s inevitable that you’ll be looking to see how you match up to your competitors. It’s easy to assume you should only be tracking things like traffic and revenue in comparison to competitors, but the same is also true for click-through rates.
The benefit of analyzing your own rates in comparison to your competitors goes beyond seeing how you match up. If you find that your competitors are getting better rates, you may see certain trends in their ad design or copy that lead to this.
If your ads are doing better than your competitors, you can also analyze the differences to see where your advantages lie. Consider analyzing the number of conversions you get from your ads—the average for Amazon ads, for example, is 26 per user per day. If you’re using this metric, or one you set on your own, you can get a new perspective by comparing it to your competitors.
Of course, comparisons in your own industry can only reveal so much. There’s also information to be gained from comparing your click-through rate to your own industry average, and other industries as well.
2. Analyze where you rank across industry averages.
Click-through rates can sometimes be dependent on your industry. Some industries have a less challenging time with advertising. If your product or service is easier to sell, or at least easier to promote, your average metrics could be higher.
It can be easy to get caught in the mindset that only your own industry’s benchmarks matter. Yet, examining average click-through rates across different industries, even for a single platform, can provide some big insights. The chart below is based on Google Ads accessed via mobile.
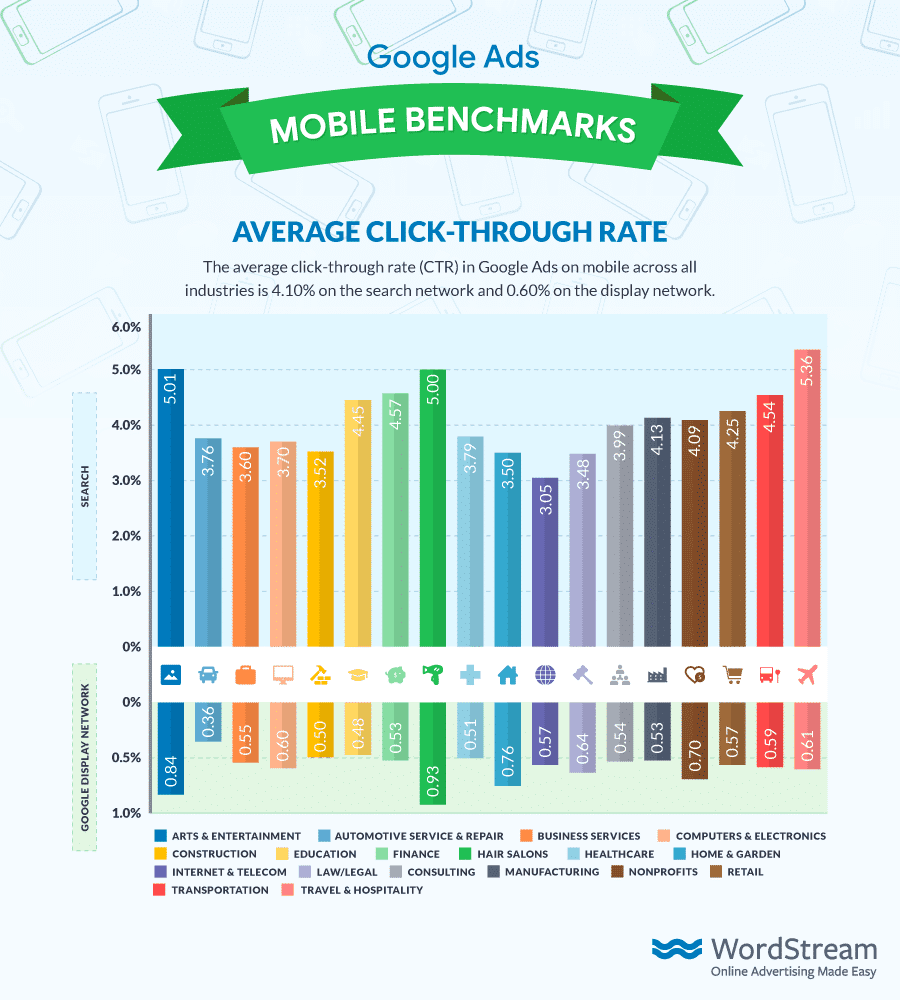
Image from Smart Insights
Let’s say your company is based in an industry that typically struggles to get high click-through rates. Maybe you’re in a niche field, or your offerings are simply harder to target and promote. If you find one of your ads is ranking as high as those people in industries where average rates are much higher, you know you’re on the right track.
Speaking of ads on specific platforms or from specific providers—this provides another interesting benchmark to use when tracking click-through activity.
3. Measure click-through activity on separate devices.
It’s no secret that cross-platform functionality is a pillar of modern marketing. Whether you’re sending out content or designing the platforms people use in the workplace, mastering mobile is absolutely essential.
Mobile marketing has its own unique challenges, but can also be very rewarding. There are literally millions of people scrolling through feeds on their phones, and therefore there’s a lot of potential for your ads to be seen.
About 5 billion people now have a mobile phone connection.
With the right tools, you can track your performance with click-through rates on mobile vs. desktop users. What are the benefits of this? For one, you learn more about your audience and how to optimize your ads.
The other benefit is finding out whether you should be putting more effort into one platform or the other—either they’re equal in rates, or you have an indication about which way you should sway your efforts.
Some of your ads may not be fully optimized for mobile. If your mobile rates are down, you may need to focus on a more responsive design.
4. Measure click-through rates by ad type.
The success of your ads and how they facilitate click-through activity involves a lot of factors. And it’s more than just your industry and the platform your users are viewing your ad on. Sometimes, it’s about the type of ad you use.
There’s the popular mid-page unit (MPU) ad, which is conveniently placed near the center of the page. It’s great to ensure the user isn’t bombarded by a promotional effort as soon as they log on, but also ensures they don’t have to scroll to the bottom to see it.
There’s also the leaderboard ad—some people prefer to have their ad at the top of the page. This ensures it’s seen before anything else, and can give the user a chance to consider clicking through it before they become immersed in the content below.
There’s also the classic side ad, which can sometimes even scroll across the entire page. These ads may seem a little intrusive to some, but some marketers will choose them if they’re running a PPC campaign—it can make sure users have a chance to consider the ad.
You may find that for your industry or the campaigns you’re creating, a certain type of ad facilitates more click-through activity. Even if you’re using the same type of ad, it’s entirely possible it’ll be more successful in one iteration than another.
Analyzing benchmarks according to ad type can help you save money when it comes to creating better PPC campaigns.
5. Compare click-through rates by date.
One of the best benchmarks you can use to gauge the efficiency of any ad type is time. Companies and individual marketers often monitor their metrics according to a few common benchmarks. These include money spent, money earned, and leads generated.
However, gauging ads and their associated metric by time is also helpful. In terms of benchmarking your click-through rates chronologically, you can do the following:
-
Analyze how long it took to reach a certain rate.
-
Gauge different (but similar) campaigns launched in the same time periods.
-
Study how click-through trends drop off after a given time period when an ad is active.
These are just a few of the valuable benchmarks you can use to study your click-through activity. It can reveal some interesting insights.
You can also determine whether your PPC campaigns are better saved for certain times of the year when ad traffic is more lucrative, or whether some campaigns should have their time frame extended (or shortened).
Time is money. And when it comes to PPC ads and getting the click-through rates that marketers seek to achieve, taking time into account can help anyone gain better insights to help drive better results.
Wrap up
Click-through rates are one of the more important metrics marketers must monitor. When it comes to getting those CTAs followed and facilitating those follow-through steps, having the right benchmarks can make all the difference.
You can analyze these rates by industry, timeframe, ad type, and more to see how your rates stand and how you could stand to improve them. Remember:
-
Click-through rates are important, but don’t tell the whole story (at least by themselves).
-
Cross-analyzing the same campaign with different benchmarks reveals different, valuable insights.
-
The better your insights are, the more successful your campaigns will be.
There are some metrics that show as much on the surface as they do when you dig into them. Click-through rates show insights in both ways.
Whether you look at them in a simplified way or analyze them alongside other marketing metrics, you can find a lot of information to help you improve traffic growth and lead generation.